
Ethereum Value and Price (Part 2)
In the first part, we have discussed the determinants of money and to what extent Ethereum fulfils these requirements. Now to the tricky part - valuation.
We have yet to find the optimal valuation model for cryptocurrencies. The prevailing ones are mere suggestions adopted from the traditional markets, which have completely different characteristics as well as way less variables than the dynamic digital space. This is but an attempt to quantify the growth potential of Ethereum, the second largest cryptocurrency by market cap and the native token of the biggest application blockchain.
Ethereum And Bitcoin Are Different In Nature
Most valuation models out there discuss the methods to value Bitcoin. Why then? First of all, Bitcoin is one of the oldest cryptocurrencies, meaning data's availability and sufficiency. It also has a limited supply of 21,000,000, similar to gold and many stocks, that’s why applying existing models makes more sense. However, just as gold, Bitcoin is more of a store of value (remember, it's more of) because Satoshi designed the core architect of the Bitcoin blockchain to serve the single purpose of a ‘purely peer-to-peer version of electronic cash', which explains the lower throughput and the lower adaptability of this blockchain.
Meanwhile, Ethereum was created as an application blockchain right from the start. It has built-in smart contract functionality that can process more transactions per second, allow developers to build with ease and be adapted for multiple uses. Anyone using Ethereum has to pay for their activities (gas fee) with ETH, a reason to link ETH price changes with the expansion of the Ethereum ecosystem. That is not to mention L2, bridges, oracles, and other entities outside of Ethereum utilising this blockchain.
Valuing Ethereum used to be more complicated than Bitcoin due to the inflationary mechanism of ETH supply. Luckily The Merge took place with one major aspect being the reduction in daily ETH issuance; it should make the process much easier moving forward. With Ethereum’s 30-day volatility falling to the lowest level in its history on June 06, 2023 and its 90-day volatility on June 27, 2023, predicting ETH prices using data from The Merge onwards is definitely more sensible.

It's important to note that we are about to enter the realm of optimal assumptions, where many factors are either simplified or ruled out to render the following valuation models plausible (TL;DR: take this lightly). All prices mentioned hereafter will be denoted in USD.
Supply And Demand
The economic law of Supply and Demand talks about why and how prices of an asset, product or service change. Theoretically, there are three cases where prices go up: when demand is constant and supply decreases, when supply is constant and demand increases and understandably when supply decreases and demand increases simultaneously. Given that ETH price volatility has hit record lows, we will try to explain the growth potential of this coin using supply and demand theories first.
We can calculate the elasticity of demand right off the bat using prices and Ethereum’s circulating supply. The percentage change in ETH price stands at 31.39% (from 1,472 on September 16, 2022 to 1,934.05 on July 01, 2023), whilst the figure is -0.24% for the coin’s circulating supply. That translates to an absolute value of 0.01 for price elasticity, denoting a near constant demand for ETH regardless of market forces’ actions.

The highest annualised daily deflation rate of Ethereum supply from September 16, 2022 to July 01 2023 is 3.9%. Prices in the same period demonstrate the tendency to rise in tandem with this rate as shown in the chart below. Using trendline as the ‘best guess’, it’s highly possible that ETH price can approach 3,800 - 4,000. As the supply change is lower than 0 (deflationary) on 194 out of 289 days since The Merge or two-third of the time, we are 67% sure of this estimate.

Assuming demand remains the same, ETH price should double if supply is reduced by half, right? That scenario is, unfortunately, too hard to be realised: It takes at least 14 years (take our best guess of 5% supply reduced annually) for ETH supply to drop from ca. 120 million to 60 million. Most people want their investments to be as profitable as possible in the shortest time, so we better cross this off our list of possible cases.

When it comes to demand, Total Value Locked (TVL) and on-chain volume appear to be the two fair choices. TVL is more reliable in the sense that it fluctuates much less than the other metric; on-chain volume is subject to changes due to unsustainable causes such as an influx of airdrop seekers and thus should exert a smaller influence on ETH prices (see the near horizontal trendline).

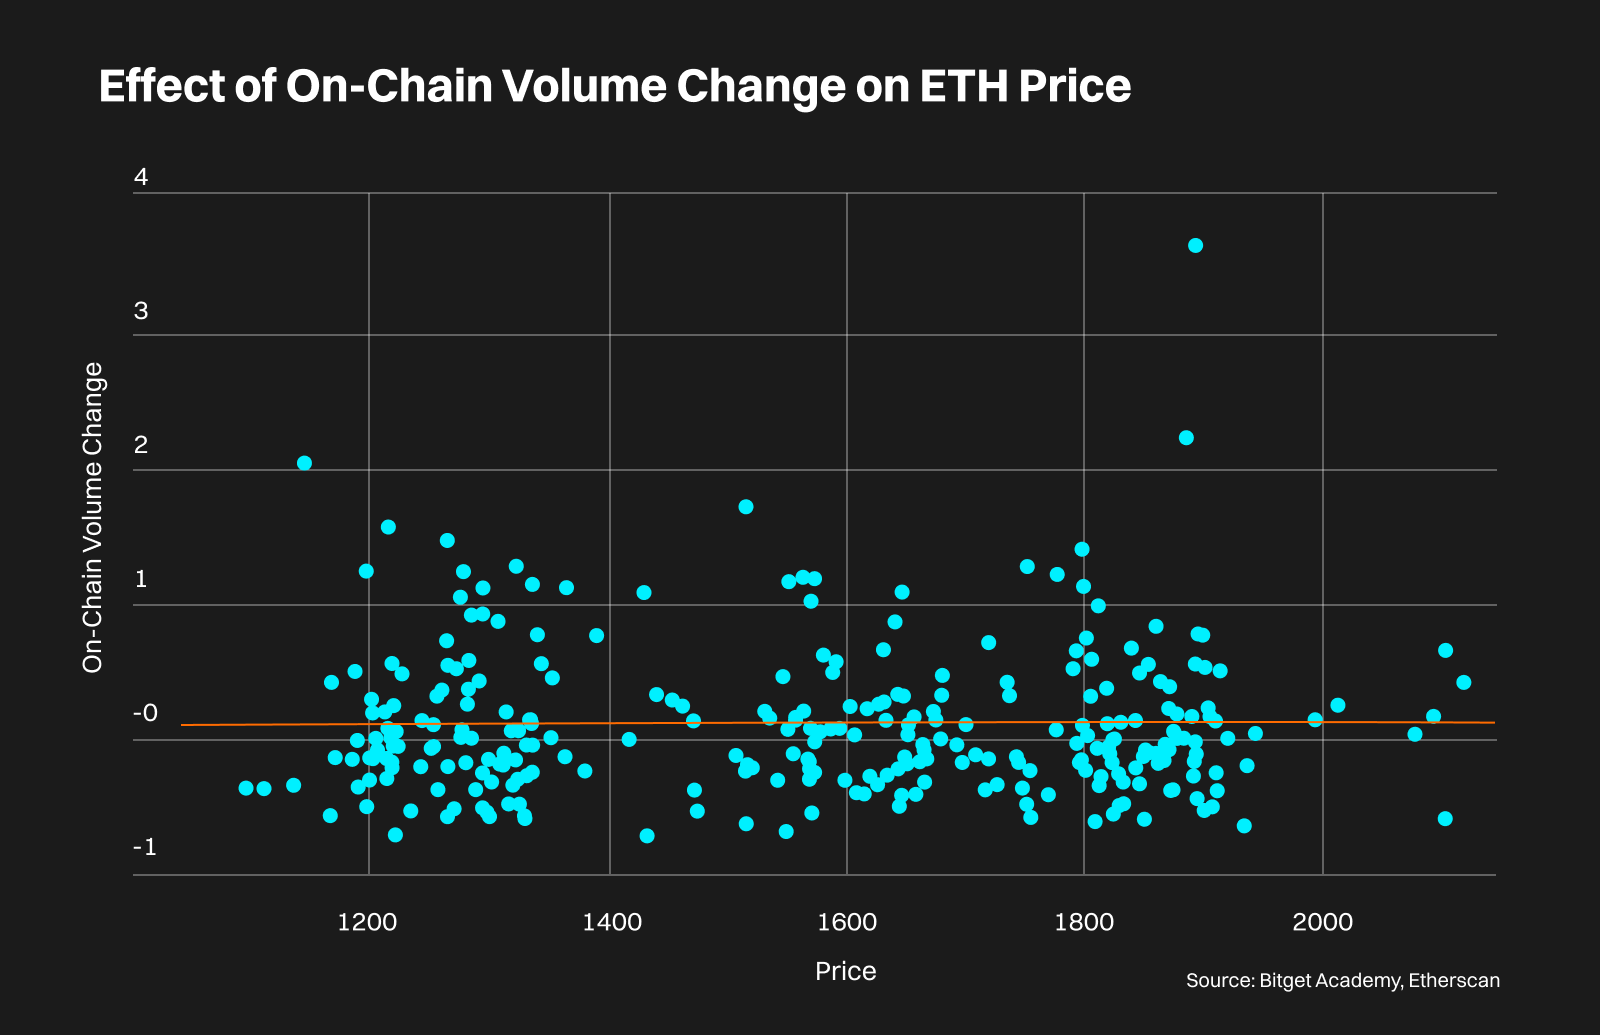
The charts above allow us to have a general idea of how supply, TVL and on-chain volume can affect ETH prices. We will now try to build a regression model, which describes the relationship between a response variable, here the ETH price, and three above-mentioned metrics as explanatory variables. In layman’s terms, it’s time to see how much ETH price moves when each predictor changes.

Source: Bitget Academy
This is a summary of our model. The statistics say that this is an acceptable model and accordingly, ETH price can be predicted as follows:
• Date and supply are more trusty; on-chain volume is the least significant input
• Supply and on-chain volume are negatively correlated with ETH price
• ETH price increases when TVL rises
• ETH price increases every day
There are some overlapping periods between the predicted ETH price (price fit) and the actual ETH price, and the price fit graph almost looks like the trendline for ETH price. Please note that this model doesn’t take into account events e.g. the FTX fall in November 2022 or the Shapella upgrade in April 2023, hence the different values.

If we agree that this model is good enough for a rough approximation of ETH price, we can make some projections for ETH prices as follows:

Despite the implication that on-chain volume and ETH prices diverge from one another, we still consider it a measure of demand, though a fallible one. For the current (as of July 01, 2023) annualised daily deflation rate of ETH supply to increase every year and reach the peak of 3.9% at the end of 2030, we expect an acceleration rate of 0.6. Likewise, 0.1 is simply fair for a depreciation rate of TVL and on-chain volume of Ethereum in view of the developments of existing and potential new L1 blockchains. Even with a bold assumption of 0.5 depreciation rate for Ethereum on-chain volume, the nominal ETH price projection for 2030 would be 112,046.
Basically, 2023 has been good for Ethereum with its price going from 1,196.61 on January 01, 2023 to 1,934.05 on July 01, 2023. If the coin can keep up this pace, the corresponding projected value will be much higher than those derived from supply/demand metrics with an inflation-adjusted ROI of 104.1% (assuming 2% yearly CPI change). The safest bet stands at 2,164 at the end of 2030, which is equivalent to a ROI of 11.9% or an inflation-adjusted ROI of 2.3%.
Metcalfe’s Law For Ethereum
The premise of Metcalfe’s law lies in the expectation that the value of a product or service lying at the core of a network will increase through network operations. The Ether coin is used for everything that runs on the Ethereum blockchain, suggesting that there should be some mirroring between ETH price or market cap (as the blockchain’s value) and its user base. Then we can try applying Metcalfe's law for ETH price forecasting.
The question is what to choose as a good indicator of Ethereum users. We put the daily active addresses and daily transactions to the test while (intuitively) leaning towards the former. Again we use regression to fit the Metcalfe’s curve to each given metric, but this time within a longer (5-year) time frame.
Using the coefficient of determination as the key statistics for the usefulness of this model, it’s safe to say that neither daily active addresses (46.7%) nor daily transactions (52.2%) is a decent predictor for ETH prices. This being the case, our ETH price projections using this approach should be less reliable than the one for supply and demand.
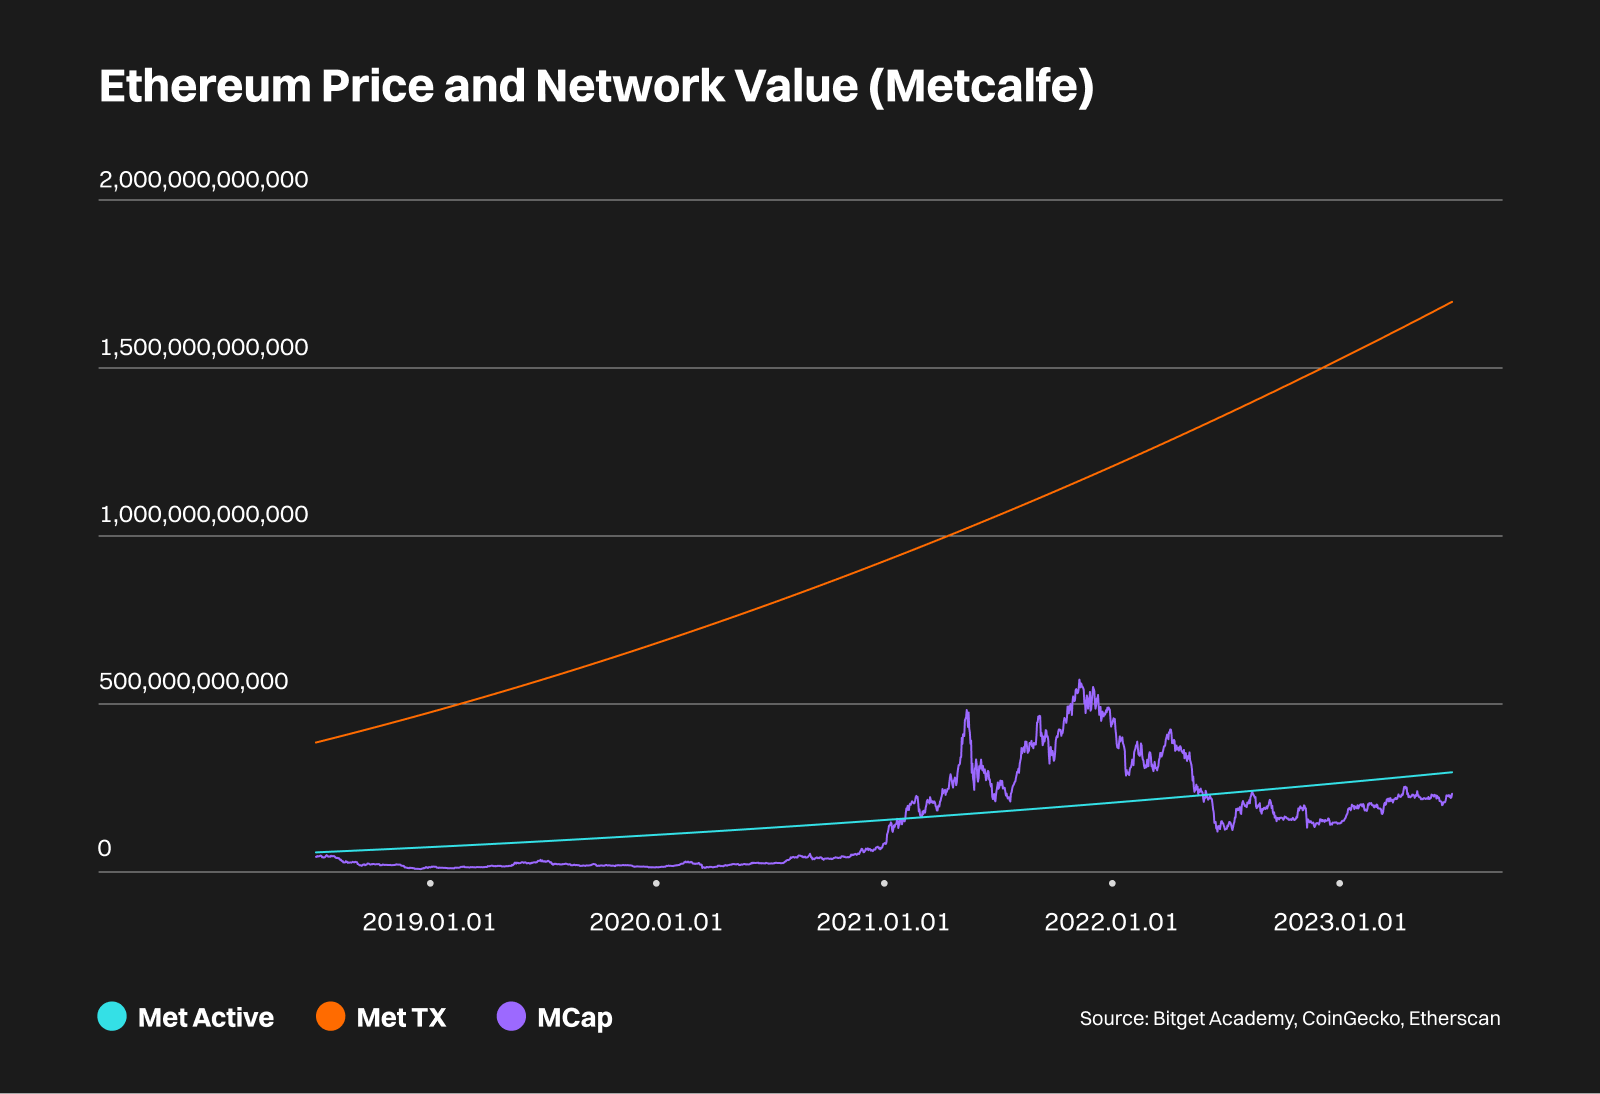
The fair value estimate for Ethereum using daily active addresses (Met Active) is quite close to the coin’s actual market cap whereas using daily transactions as a user proxy (Met Tx) results in a much higher estimate. As of July 01, 2023, Met Active and Met Tx are 27.5% and 629% higher than the market cap of Ethereum, signalling considerable room for price growth.
Between 2021 and June 2022, Ethereum price was overvalued compared to the Met Active. A lot of climactic events took place during that time: Bitcoin price recorded its all-time high near 70,000 in November 2021, the NFT of Beeple’s Everydays: the First 5000 Days was sold at the premier auction house Christie’s as the most expensive NFT in the history and the ‘third-most expensive work from a living artist ever sold at auction’ for a staggering 38,525 ETH or US$69.3 million at that time and technical preparation for the Ethereum Merge in 2022. That surge in Ethereum’s market cap is therefore adequately explained by a big jump in the transaction activity, which equals the ratio between on-chain volume and the Met Active value.

Should we accept either of the Metcalfe values as Ethereum’s true value and 0.3% as the annual deflation rate of the coin’s supply, the future price of ETH can range from 2,520 to 14,405 in 2030 with the respective ROIs being 30.3% and 645%. Since the efficacy rate of Met Active and Met Tx is around 50% only, it’s better to turn to the forecast derived from the current ETH price (1,934 as of July 01, 2023) and its growth rate since The Merge (40% p.a), which produces an inflation-adjusted ROI of 37.25% or a nominal return of 12.45x in 7 years.

Conclusion
Let’s go back to the inelastic demand of ETH as a direct result of the Ethereum Merge. None of the predictors (supply, TVL, on-chain volume, daily active addresses or daily transactions) can provide a sound projection as ETH actual prices. Be it growth rate since after The Merge or in H1 2023, we can most likely expect Ethereum prices to continue to rise consistently thanks to the growing demand for this coin as the best BTC alternative and the coin of highest utility. See how the U.S. Securities and Exchange Commission (SEC) always leaves out ETH in their crypto-related cases, the line-up of Ethereum ETF applications waiting to be approved or the U.S. former President Trump’s US$2.8 million Ethereum wallet and you’ll know that Ethereum has every reason to be the most suitable for mainstream adoption. Or second-most if you are a Bitcoin maximalist.
Related article: Bitcoin Value and Price
Disclaimer: The opinions expressed in this article are for informational purposes only. This article does not constitute an endorsement of any of the products and services discussed or investment, financial, or trading advice. Qualified professionals should be consulted prior to making financial decisions.


 No data